ENVS475 Homework 5: point estimates
Spring, 2023
Assignment Format
- Open a new R script
- Save your R script in the
homework/folder - Name your script according to:
full_name_hw##.R- For example:
justin_pomeranz_hw05.R
- For example:
- Comment before each problem, and each sub-problem
- Make sure your results print out on
Source with echo- If you’re answer is saved in an object, make sure you print out that object afterwards
Setup
Load packages
- Make sure that the
dplyrandggplot2packages are downloaded on the machine you’re using- You can check this by clicking on the
Packagestab in the Files, Plots, Packages… panel and scrolling down - If you need to download the package, copy the following code into your Console panel and run it **Do not put it in your homework script*
install.packages("dplyr")
- You can check this by clicking on the
- Copy the following code into the beginning of your homework script
to load the
dplyrpackage:
# load libraries
library(dplyr)
library(ggplot2)
Data
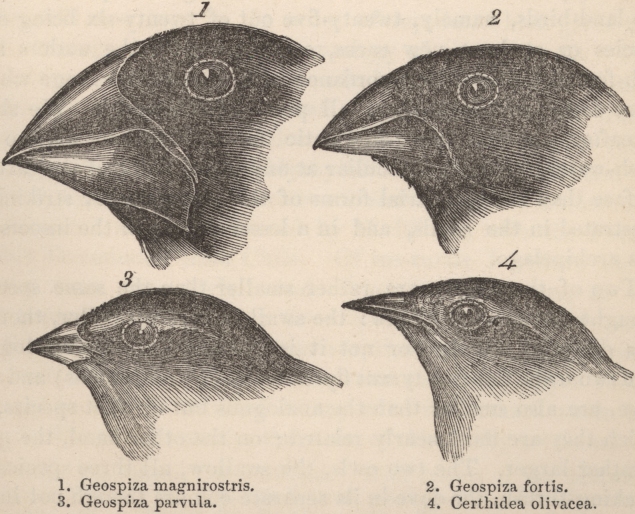
For this homework assignment, we will be working with real data from “Darwin’s Finches” in the Galapagos Islands. Famously, the variation in beak sizes of these birds is one of the observations which is often credited to Darwin’s formulation of his Theory of Natural Selection (although in reality he just brought back finch specimens, and museum archivists were the ones to realize the diversity of species on the islands).

Figure By John Gould (14.Sep.1804 - 3.Feb.1881) - From “Voyage of
the Beagle”
Public Domain, available http://darwin-online.org.uk/converted/published/1845_Beagle_F14/1845_Beagle_F14_fig07.jpg
The beaks of the Galapagos finches was the primary detail of interest. For birds, beaks are the primary tool at their disposal, and the type (size, shape, etc.) of beak you have determines what type of food resources that are available to you, and the types of “jobs” you can do.
Regardless of Darwin’s personal affinity (or lack thereof) for these birds, they have nonetheless played an outsized role in the history of biology. In more recent times, Drs. Peter and Rosemary Grant have spent decades on the islands following the birds through time and documenting changes in Finch morphology in response to drought and other environmental conditions. Their work has been well documented, including in the popular science book Beak of the finch by Jonathan Weiner, and much of this work is summarized in an educational documentary on HHMI.
In this homework assignment, we will be working with a subset of the Grants’ beak measurement data for two of the species, Geospiza fortis, and G. scandens, collected on Daphne Major Island in 1975 and 2012. The full data set is available at Data Dryad
Download the data and read into R
Be sure to download the data galapago-finches.csv and
from D2L and place them both in your data/ folder in your R
project.
Copy the following code and put it at the top of your homework script:
finch <- read_csv("data/galapago-finches.csv")Exercises Homework 05: point estimates
Problem 1: Data Wrangling
Get to know your data by using the
names(),dim(),head(), andstr()functions.which species are present? To determine this, use the following code:
unique(finch$species)Split the data based on species, and make two new data frames, one called
fortisand one calledscandens.
- hint: use the
filter()function from dplyr.
- Remember to use
==in the filter function
- here is the code for the fortis species:
fortis <- finch %>% filter(species == "fortis")
- Now that you have an object for each species, split each of these
based on year.
- you should end up with a total of 4 objects called the following:
fortis1975
fortis2012
scandens1975
scandens2012
- print out the dimensions of all four of your new objects using the
dim()function. Do these dimensions make sense? You may want to rerun thedim()from problem 1.1 above.
Problem 2: fortis1975
- Use
ggplot()to make separate histograms for both theblengthand thebdepthvariables.
- You should make two separate plots (not a faceted plot)
- for your aesthetics, you should map your variable of interest to the
x axis:
aes(x = blength)
- Make sure to add a
+at the end of each function in order to add another layer.- Do not add a
+at the last line.
- Do not add a
- Set the number of bins to 15 by adding the following geom layer:
geom_histogram(bins = 15)
- use the
labs(title = "...")function to add a title with the species name and year.
- You can add
theme_bw()if you want to.
- Under each plot, comment on whether or not you think these variables
appear to be normally distributed.
- WHY do you think it looks normal or not?
- Make sure you begin each line of your interpretation answer with a
#to make it a comment in your R scipt.
- WHY do you think it looks normal or not?
- Calculate the mean, SD, and SEM for
blengthfor thefortis1975object.
- you may want to save each of these as a new object.
- Calculate an approximate 95% and a 99% Confidence Interval for beak
length for the fortis species from 1975.
- Hint: by approximate I mean assume a normal distribution, so your
95% CI will have a
2*and your 99% will have a3*in the calculation.
- Bonus calculate these intervals in a way that the lower and upper bounds print out as a single vector
- Interpret just the 95% CI here.
- make sure to start your interpretation with a
#in your R script.
Problem 3 fortis2012
Calculate the mean, SD and SEM for beak length for the fortis species from 2012.
Calculate a 95% and 99% CI for beak length for the fortis species from 2012.
Compare and interpret the 95% CIs for the fortis species from 1975 and 2012.
- Hint: Do the intervals cross?
- Is the mean beak length different between the years?
- How “confident” are we?
Problem 4 scandens
Calculate the mean, SD, SEM, and 95% confidence interval for the
blengthvariable for the scandens species in both 1975 and 2012.Interpret the 95% confidence intervals for the scandens species in the two years.
- Hint: Do the intervals cross?
- Is the mean beak length different between the years?
- How “confident” are we?
Problem 5 Challenge (optional)
In the above example we split the original data object into four
based on combinations of finch species and survey year. However, we
could have performed all of these calculations on the original data set
using dplyr. Using dplyr functions and the
original, complete, finch data object, calculate the mean,
sd, sem, and 95% CIs for beak length for each combination of year, and
species.
Hints
Recall the
group_by()function.summarize()collapses a large data set down to one row per groupthe
mutate()function can be used to make new column(s) based on calculations using values already in columns.