Portal Species Time-Series (Functions)
If surveys.csv, species.csv, and plots.csv are not available in your workspace download them:
Load them into R using read.csv().
Do the following (no output is expected for (1) or (2)):
- Combine the
surveysandspeciestables into a single data frame - Write a function that
- Takes three arguments - a data frame (the combined table created in (1)), a
genusname, and aspeciesname - Uses
dplyrto produce a data frame with a two columns:yearandcount, wherecountis the number of individuals (i.e., the number of rows) for the species indicated bygenusandspeciesin thatyear - Returns the resulting data frame
- Takes three arguments - a data frame (the combined table created in (1)), a
- Use your function to get the time-series for
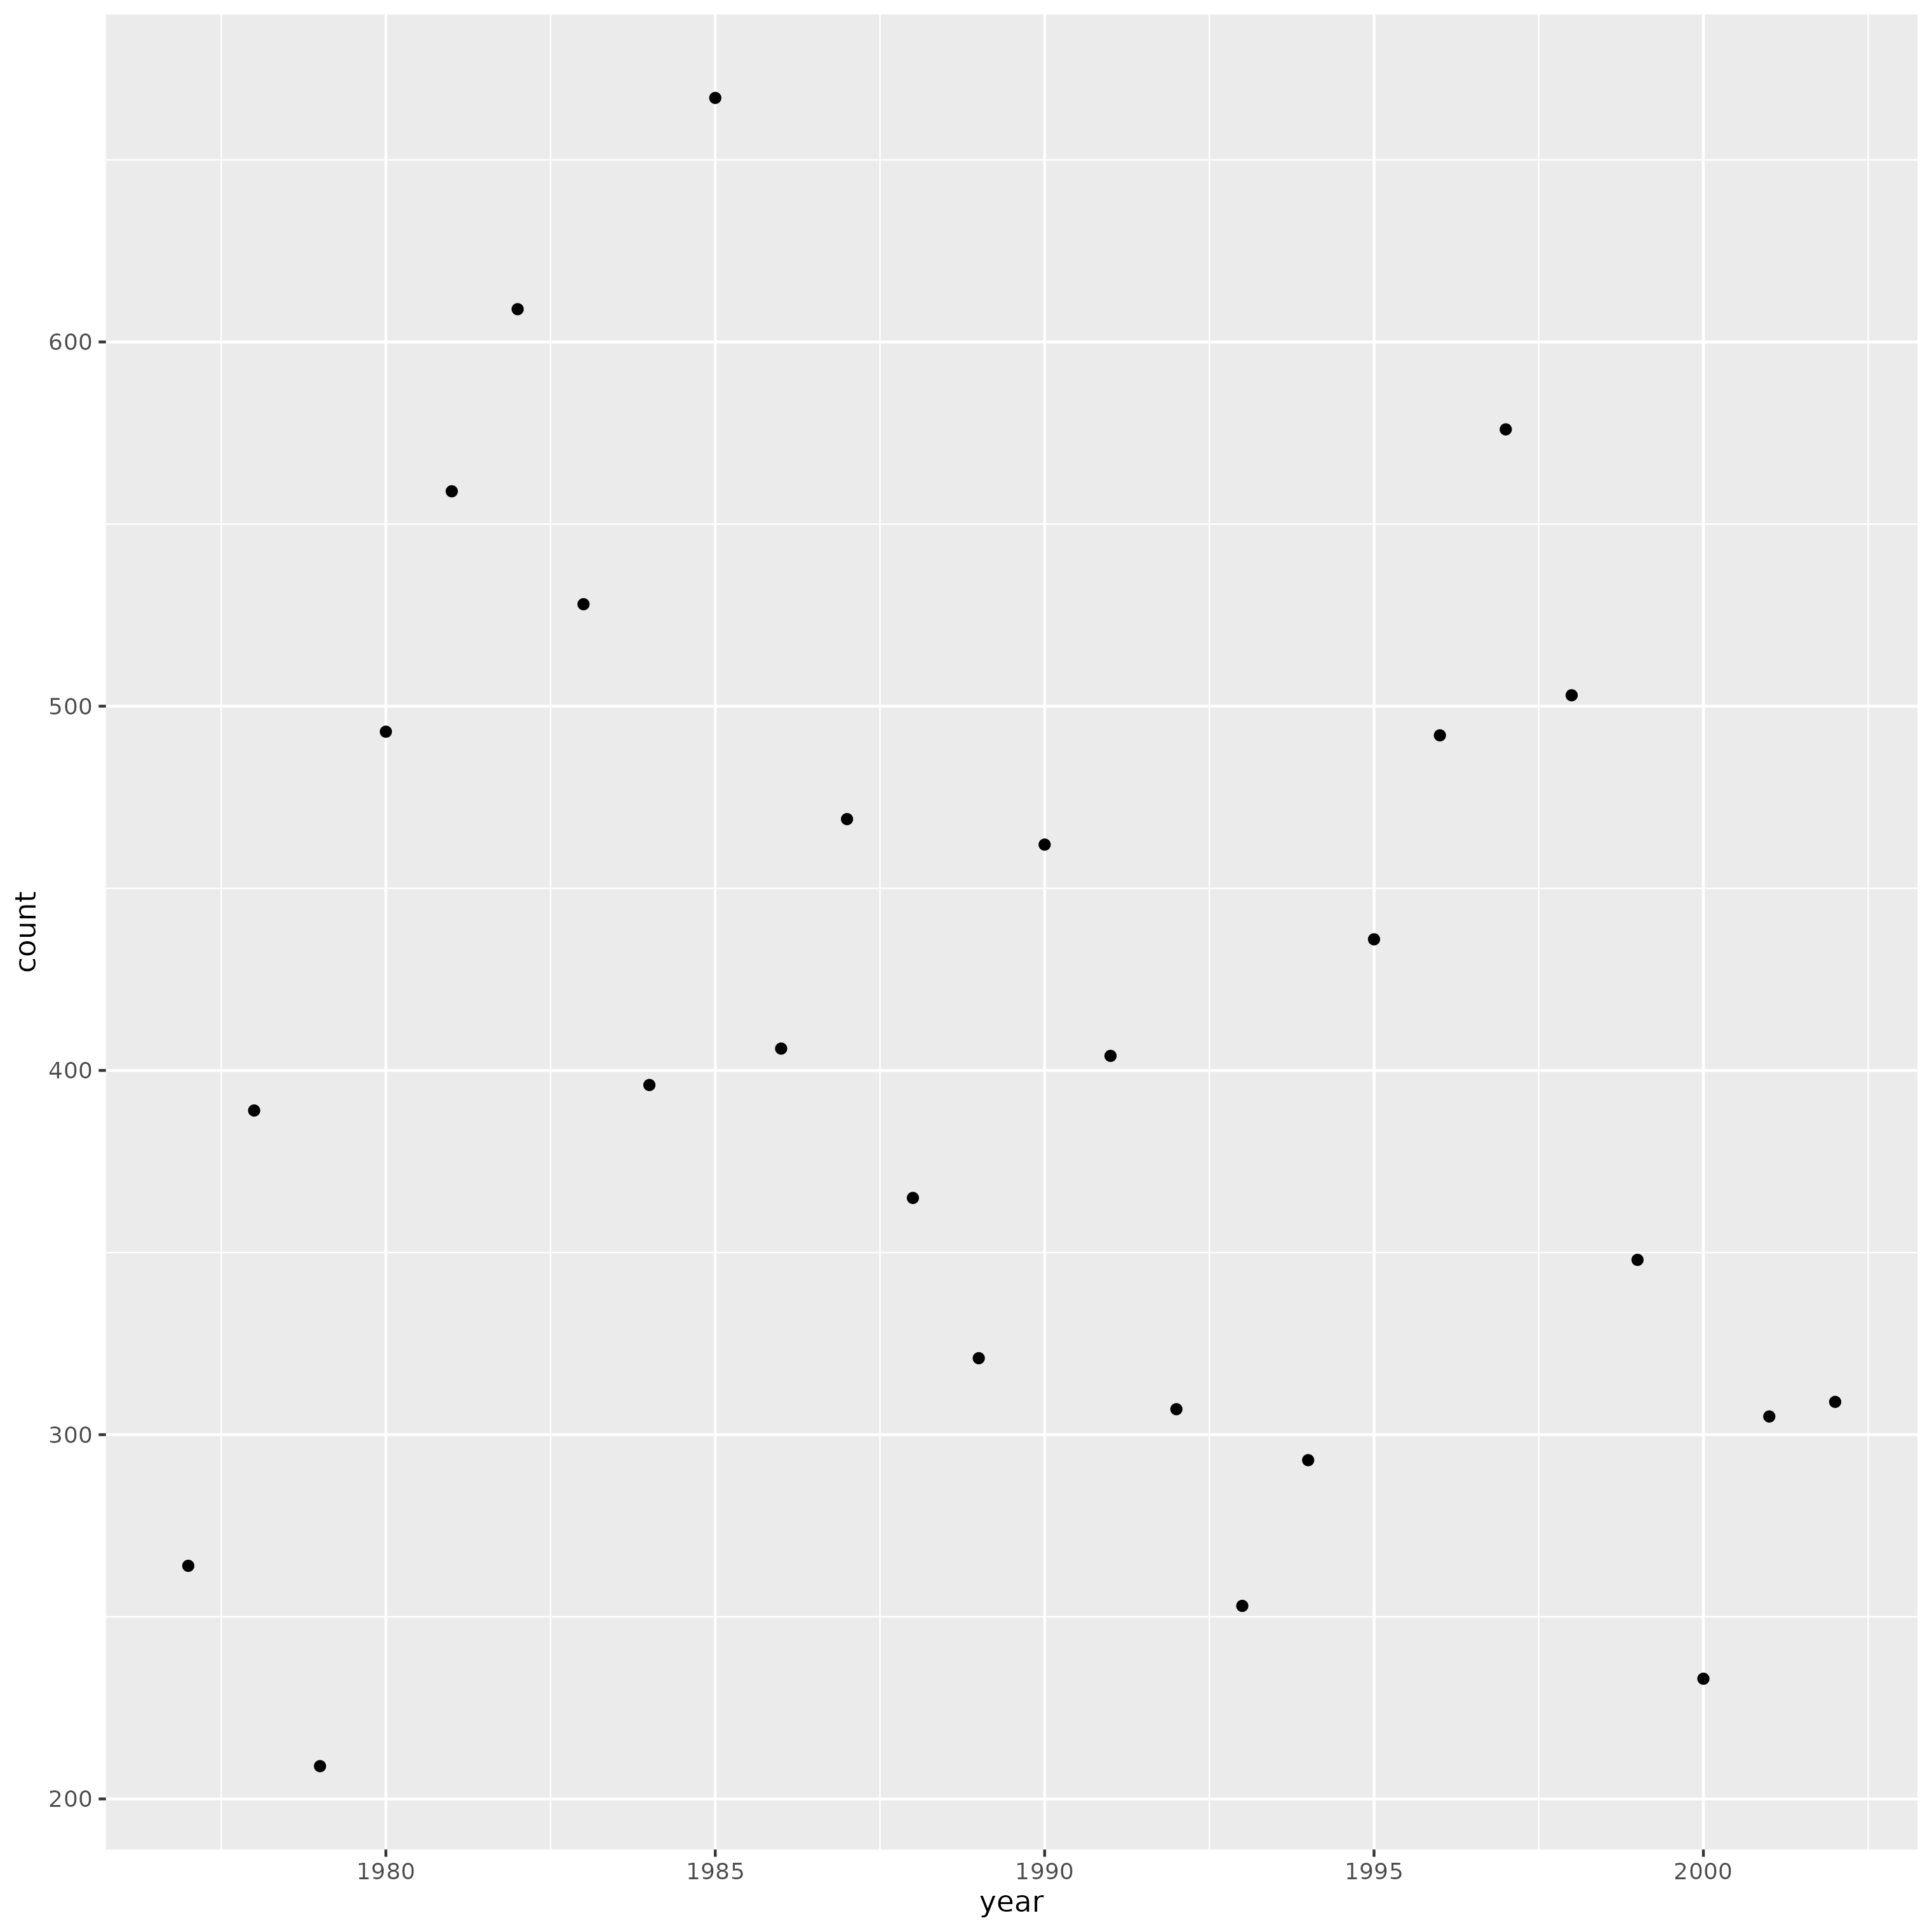
genus="Dipodomys"andspecies="merriami"and then make a graph of this time-series usingggplotthat hasyearon the x axis,counton the y axis, and displays the data as points. - Use your function to get the time-series for
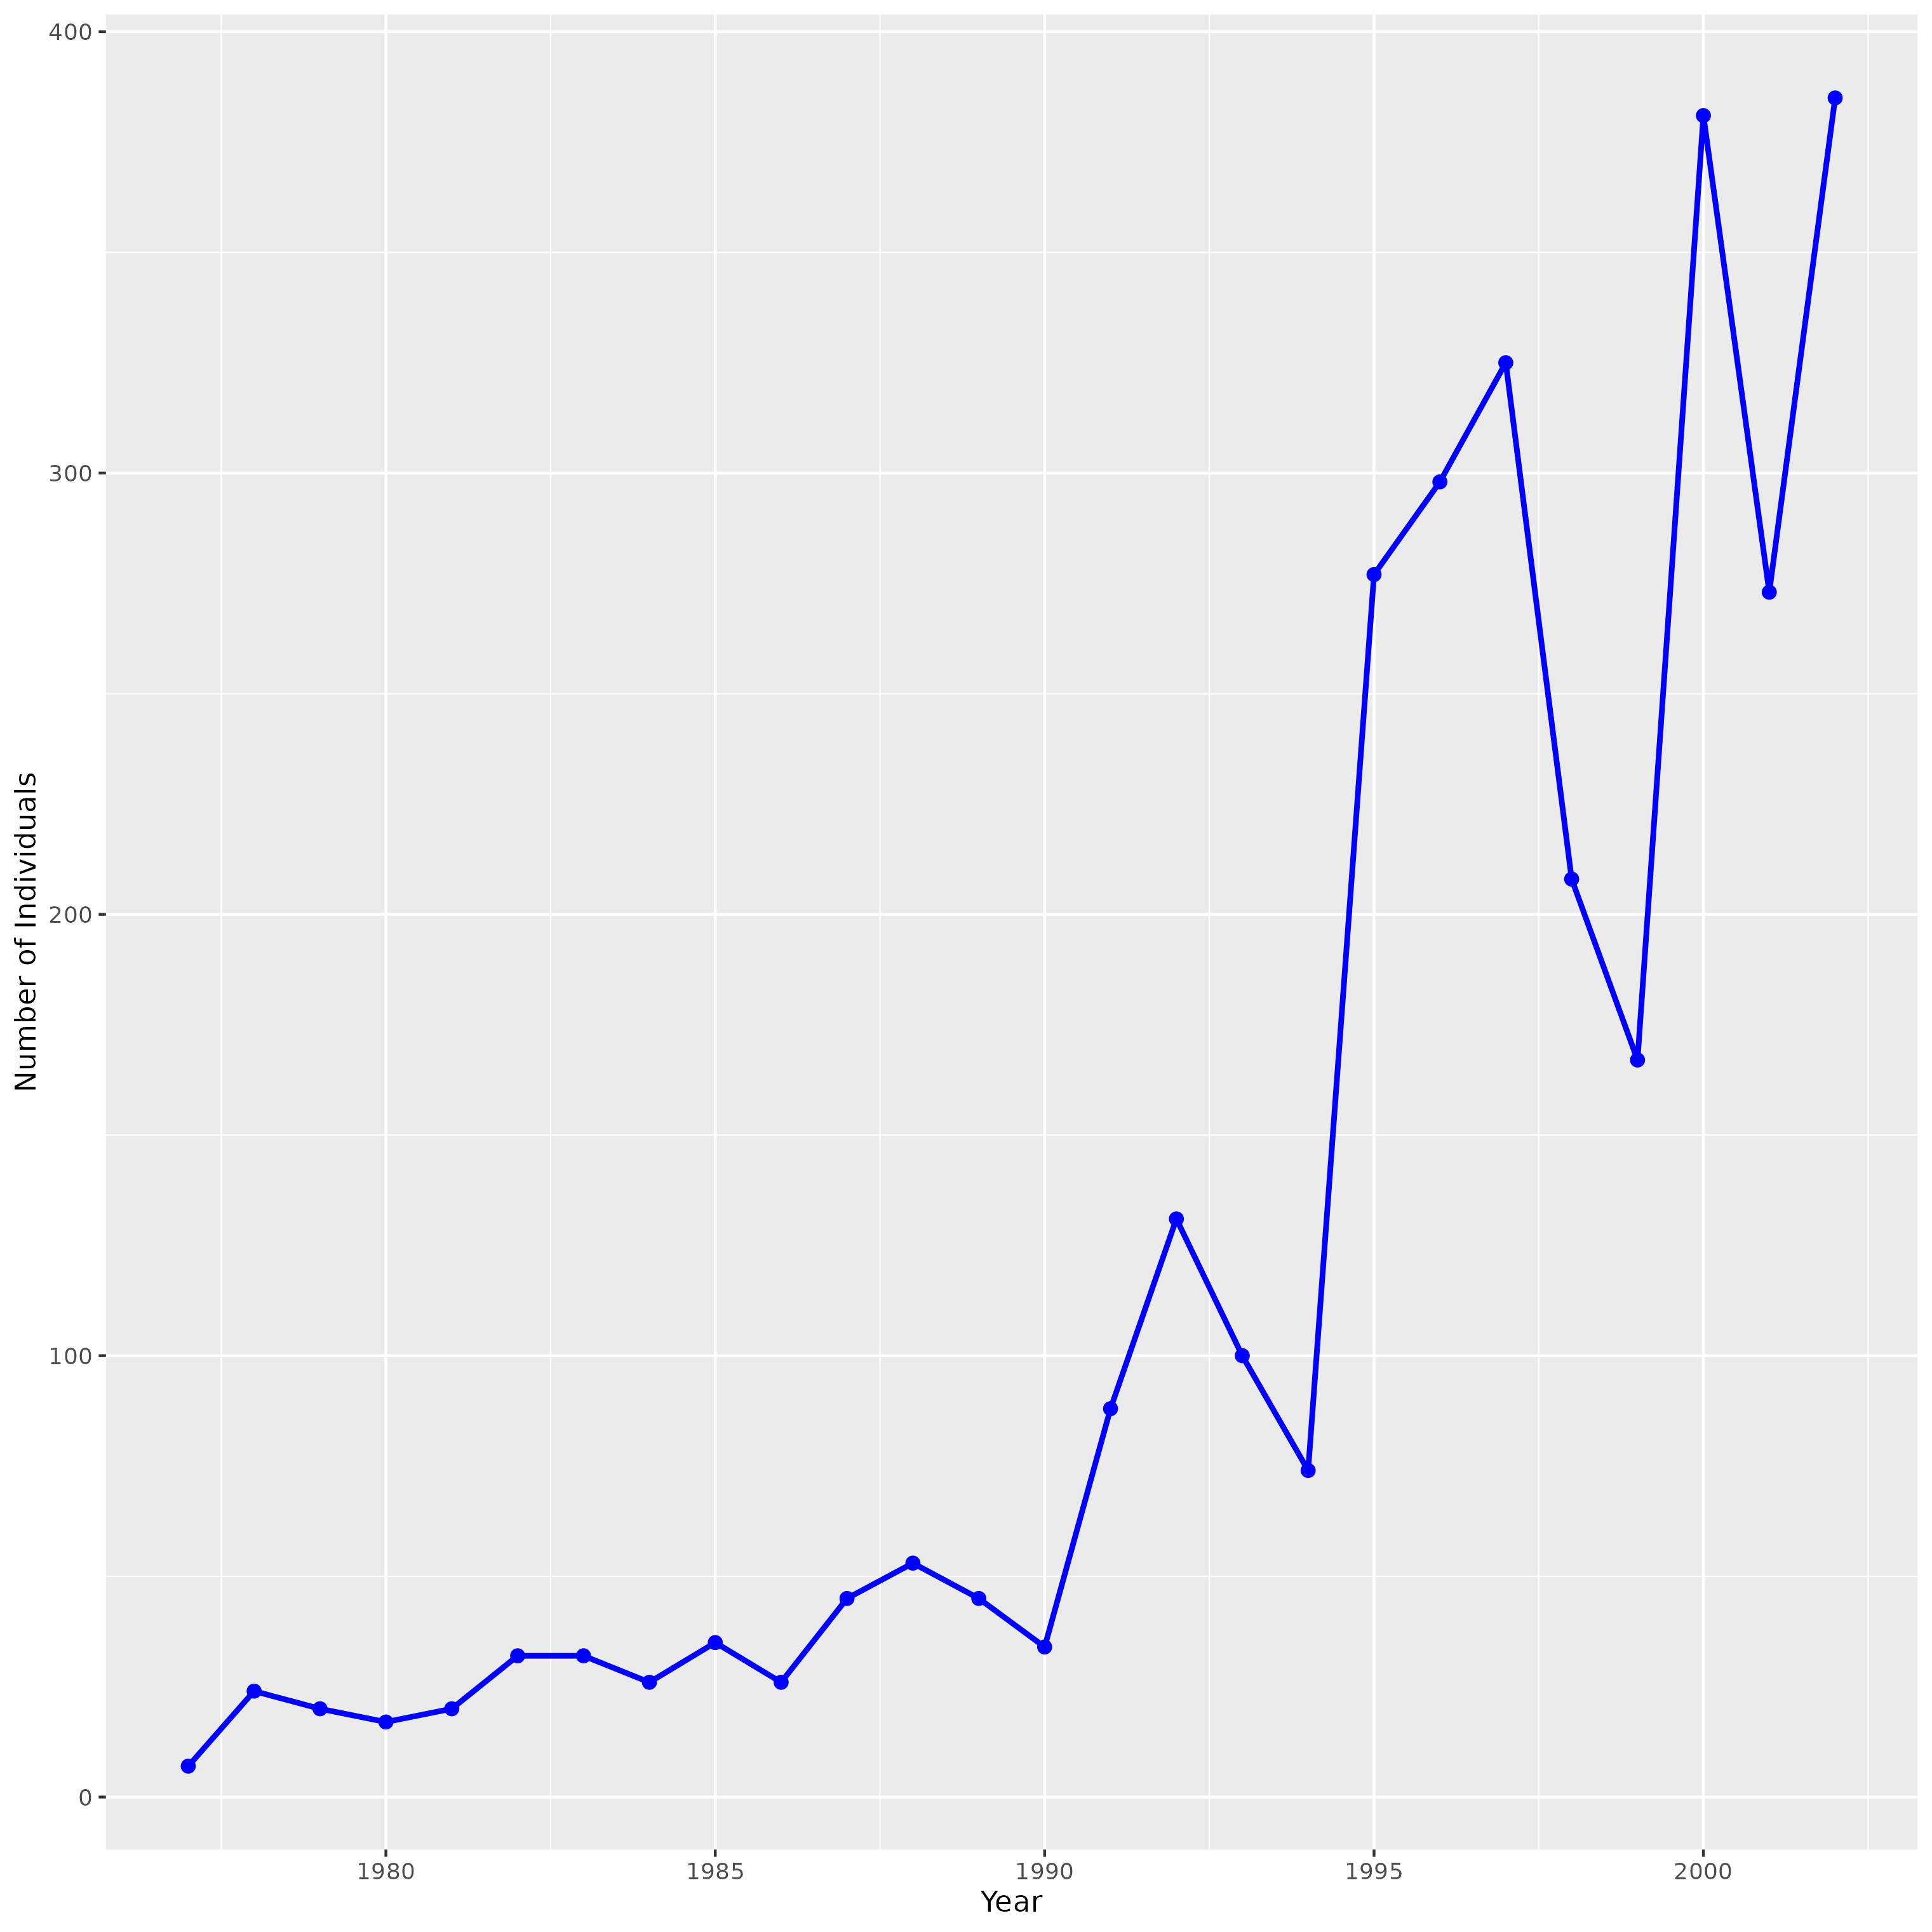
genus="Chaetodipus"andspecies="penicillatus"and then make a graph of this time-series usingggplotthat hasyearon the x axis,counton the y axis, and displays the data as blue points (with size = 1) connected by blue lines (with size = 2). Change the x axis label toYearand the y axis label toNumber of Individuals