Learning Objectives
Following this assignment students should be able to:
- use, modify, and write custom functions
- use the output of one function as the input of another
Reading
-
Topics
- Functions
-
Readings
Lecture Notes
Exercises
Writing Functions (15 pts)
Copy the following function into your assignment and replace the
________with variables names for the input and output.convert_pounds_to_grams <- function(________) { grams = 453.6 * pounds return(________) }Use the function to calculate how many grams there are in 3.75 pounds.
Expected outputs for Writing Functions: 1Use and Modify (15 pts)
The length of an organism is typically strongly correlated with its body mass. This is useful because it allows us to estimate the mass of an organism even if we only know its length. This relationship generally takes the form:
mass = a * length^b
Where the parameters
aandbvary among groups. This allometric approach is regularly used to estimate the mass of dinosaurs since we cannot weigh something that is only preserved as bones.The following function estimates the mass of an organism in kg based on its length in meters for a particular set of parameter values, those for Theropoda (where
ahas been estimated as0.73andbhas been estimated as3.63; Seebacher 2001).get_mass_from_length_theropoda <- function(length){ mass <- 0.73 * length ^ 3.63 return(mass) }- Use this function to print out the mass of a Spinosaurus that is 16 m long based on its reassembled skeleton.
- Create a new version of this function called
get_mass_from_length()that takeslength,aandbas arguments and uses the following code to estimate the massmass <- a * length ^ b. Use this function to estimate the mass of a Sauropoda (a = 214.44,b = 1.46) that is 26 m long.
Default Arguments (15 pts)
This is a follow up to Use and Modify.
Allowing
aandbto be passed as arguments toget_mass_from_length()made the function more flexible, but for some types of dinosaurs we don’t have specific values ofaandband so we have to use general values that can be applied to a number of different species.Rewrite your
get_mass_from length()function from Use and Modify so that its arguments have default values ofa = 39.9andb = 2.6(the average values from Seebacher 2001). Recommended that you renames the functionget_mass_from length2()or similar to avoid confusion- Use this function to estimate the mass of a Sauropoda (
a = 214.44,b = 1.46) that is 22 m long (by settingaandbwhen calling the function). - Use this function to estimate the mass of a dinosaur from an unknown taxonomic group that is 16m long.
Only pass the function
length, notaandb, so that the default values are used.
- Use this function to estimate the mass of a Sauropoda (
Combining Functions (15 pts)
This is a follow up to Default Argument.
Measuring things using the metric system is the standard approach for scientists, but when communicating your results more broadly it may be useful to use different units (at least in some countries). Write a function called
Expected outputs for Combining Functions: 1convert_kg_to_poundsthat converts kilograms into pounds (pounds = 2.205 * kg). Use that function and yourget_mass_from_length2()function from Default Arguments to estimate the weight, in pounds, of a 12 m long Stegosaurus witha = 10.95andb = 2.64(The estimatedaandbvalues for Stegosauria from Seebacher 2001).Tree Biomass Challenge (40 pts)
Understanding the total amount of biomass (the total mass of all individuals) in forests is important for understanding the global carbon budget and how the earth will respond to increases in carbon dioxide emissions.
We don’t normally measure the mass of a tree, but take a measurement of the diameter or circumference of the trunk and then estimate mass using equations like M = 0.124 * D2.53.
1. Estimate tree biomass for each species in a 96 hectare area of the Western Ghats in India using the following steps.
- If the file
ramesh2010-macroplots.csvisn’t already in your workspace then download a copy. - Load the data into R.
- Write a function that takes a vector of tree diameters as an argument and returns a vector of tree masses.
- Create a
dplyrpipeline that- Adds a new column (using
mutateand your function) that contains masses calculated from the diameters - Groups the data frame into species using the
SpCodecolumn - And then calculates biomass (i.e., the
sumof the masses) for each species (usingsummarize) - Stores the result as a data frame
- Adds a new column (using
- Display the resulting data frame
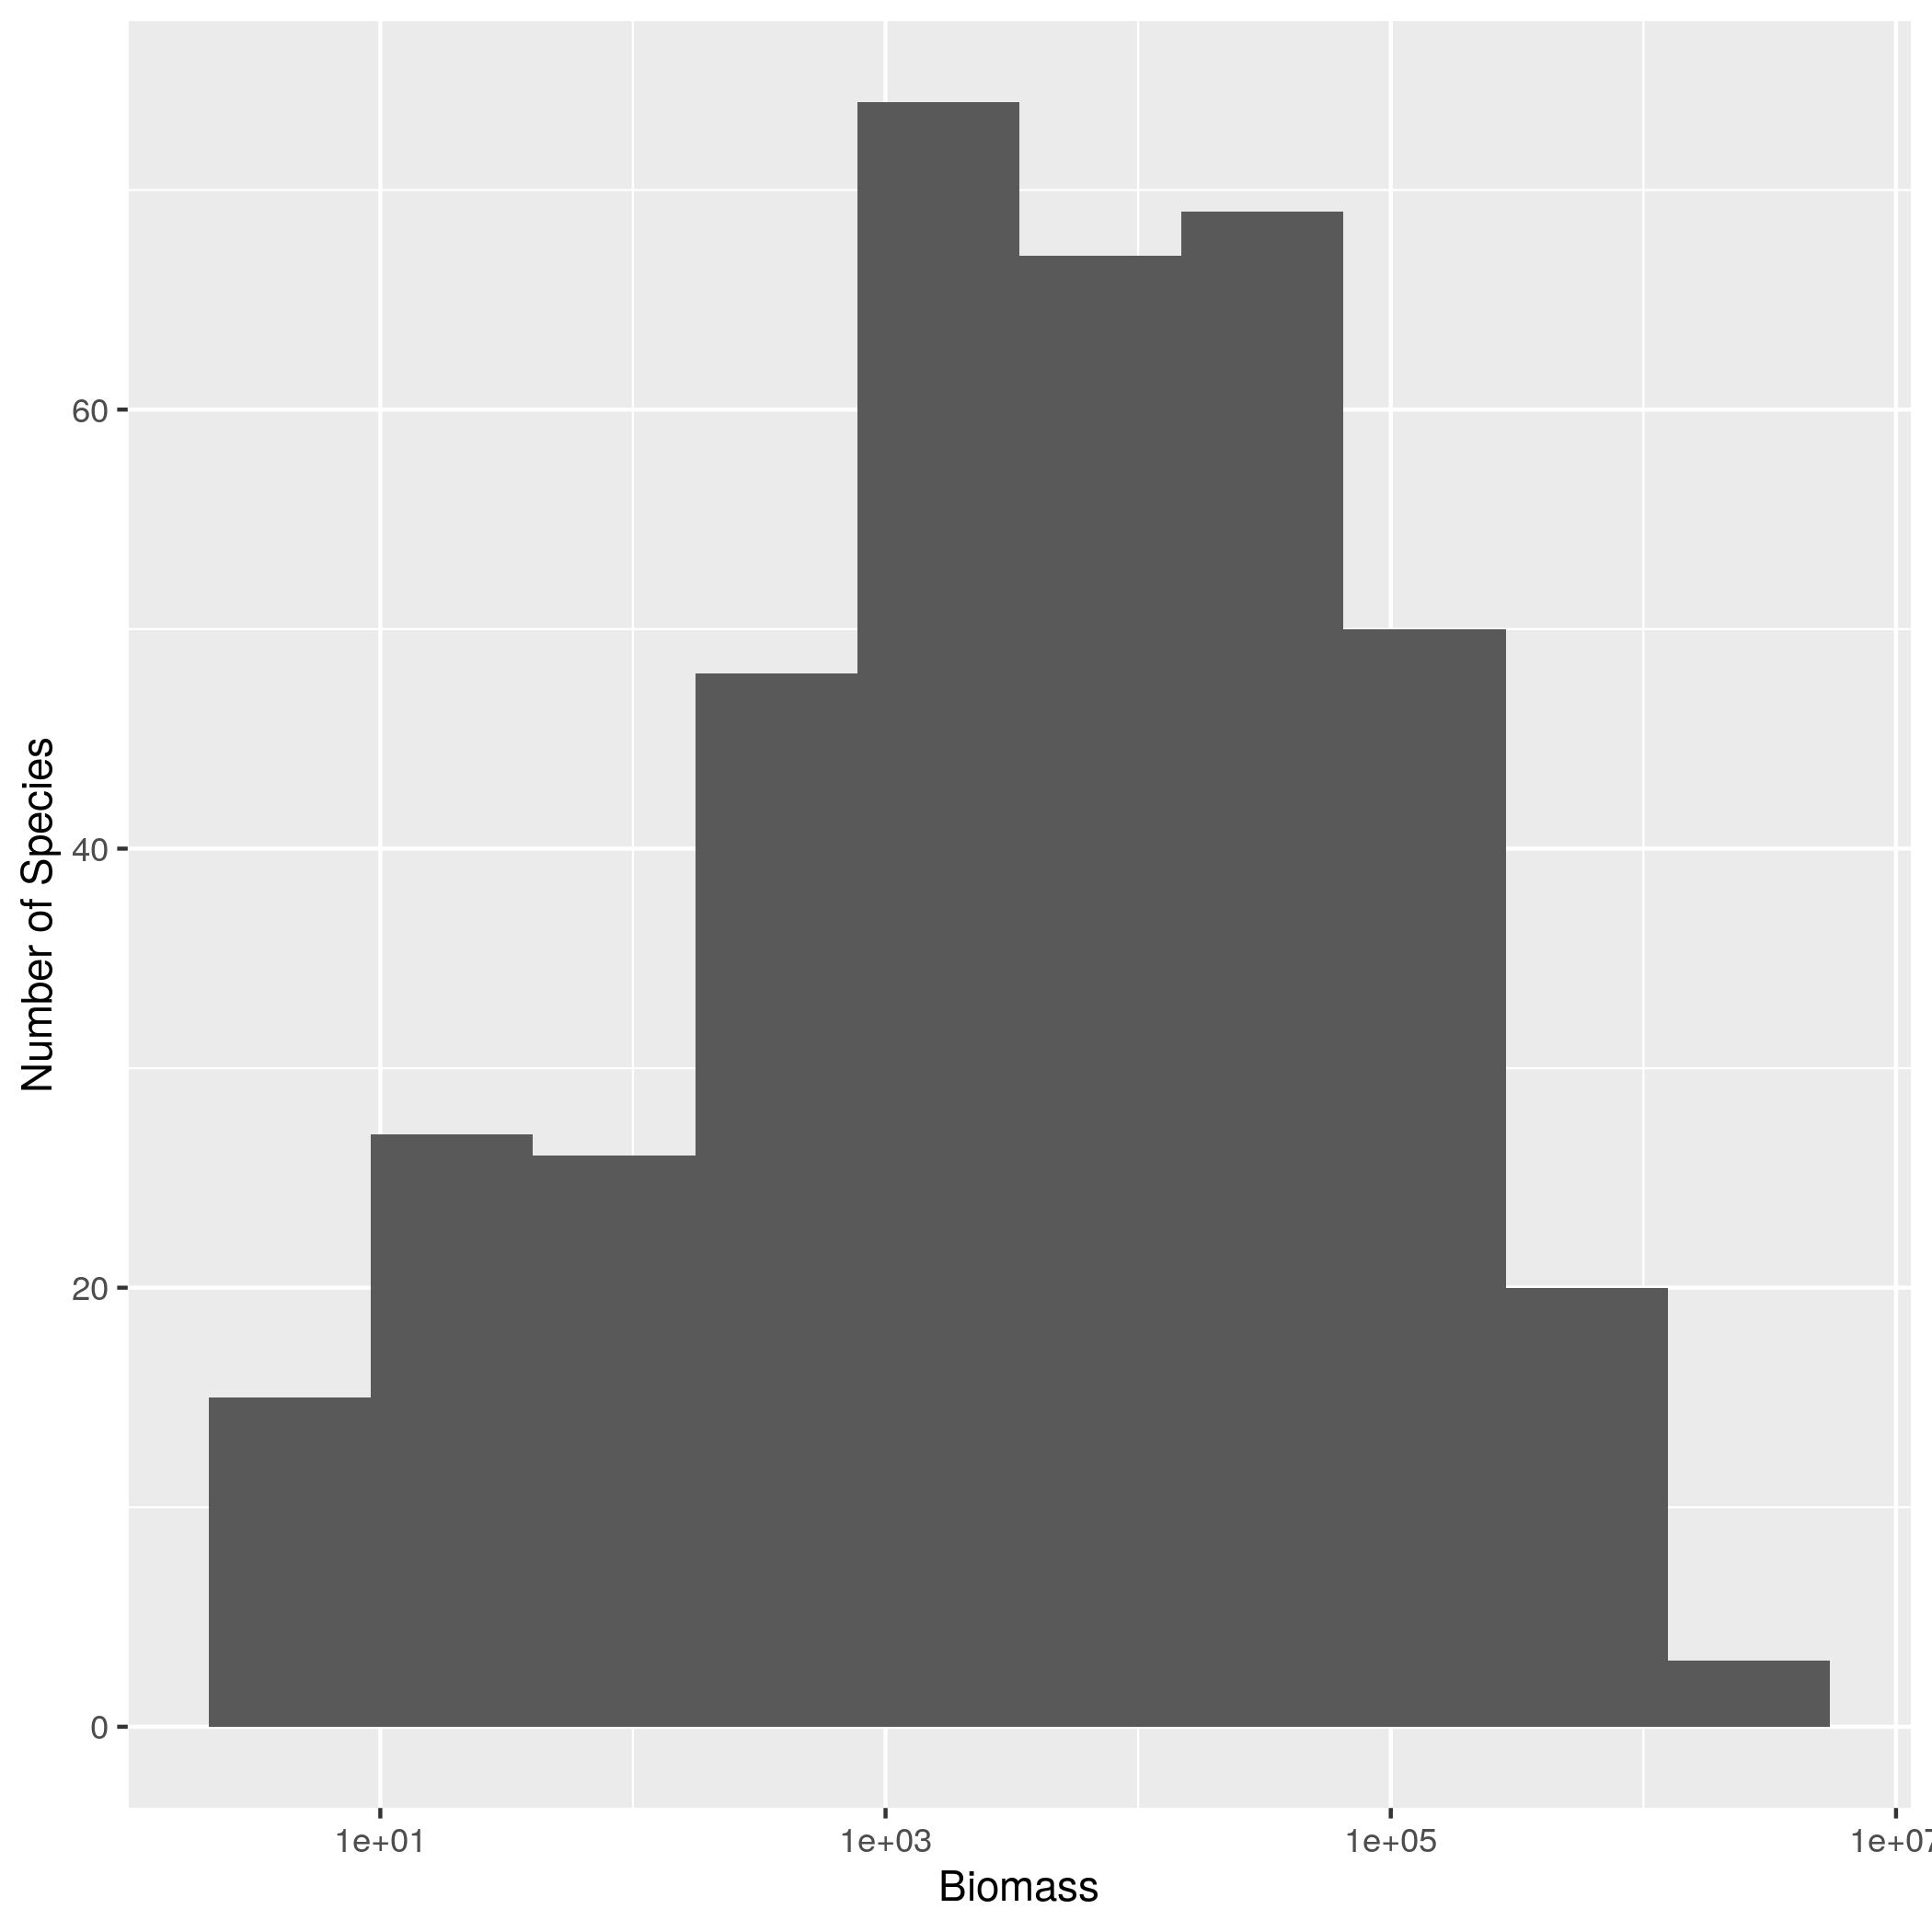
2. Plot a histogram of the species biomass values you just calculated.
- Use 10 bins in the histogram (using the
binsargument) - Use a log10 scale for the x axis (using
scale_x_log10) - Change the x axis label to
Biomassand the y axis label toNumber of Species(usinglabs)
- If the file
Portal Species Time-Series (optional)
If surveys.csv, species.csv, and plots.csv are not available in your workspace download them:
Load them into R using
read.csv().Do the following (no output is expected for (1) or (2)):
- Combine the
surveysandspeciestables into a single data frame - Write a function that
- Takes three arguments - a data frame (the combined table created in (1)), a
genusname, and aspeciesname - Uses
dplyrto produce a data frame with a two columns:yearandcount, wherecountis the number of individuals (i.e., the number of rows) for the species indicated bygenusandspeciesin thatyear - Returns the resulting data frame
- Takes three arguments - a data frame (the combined table created in (1)), a
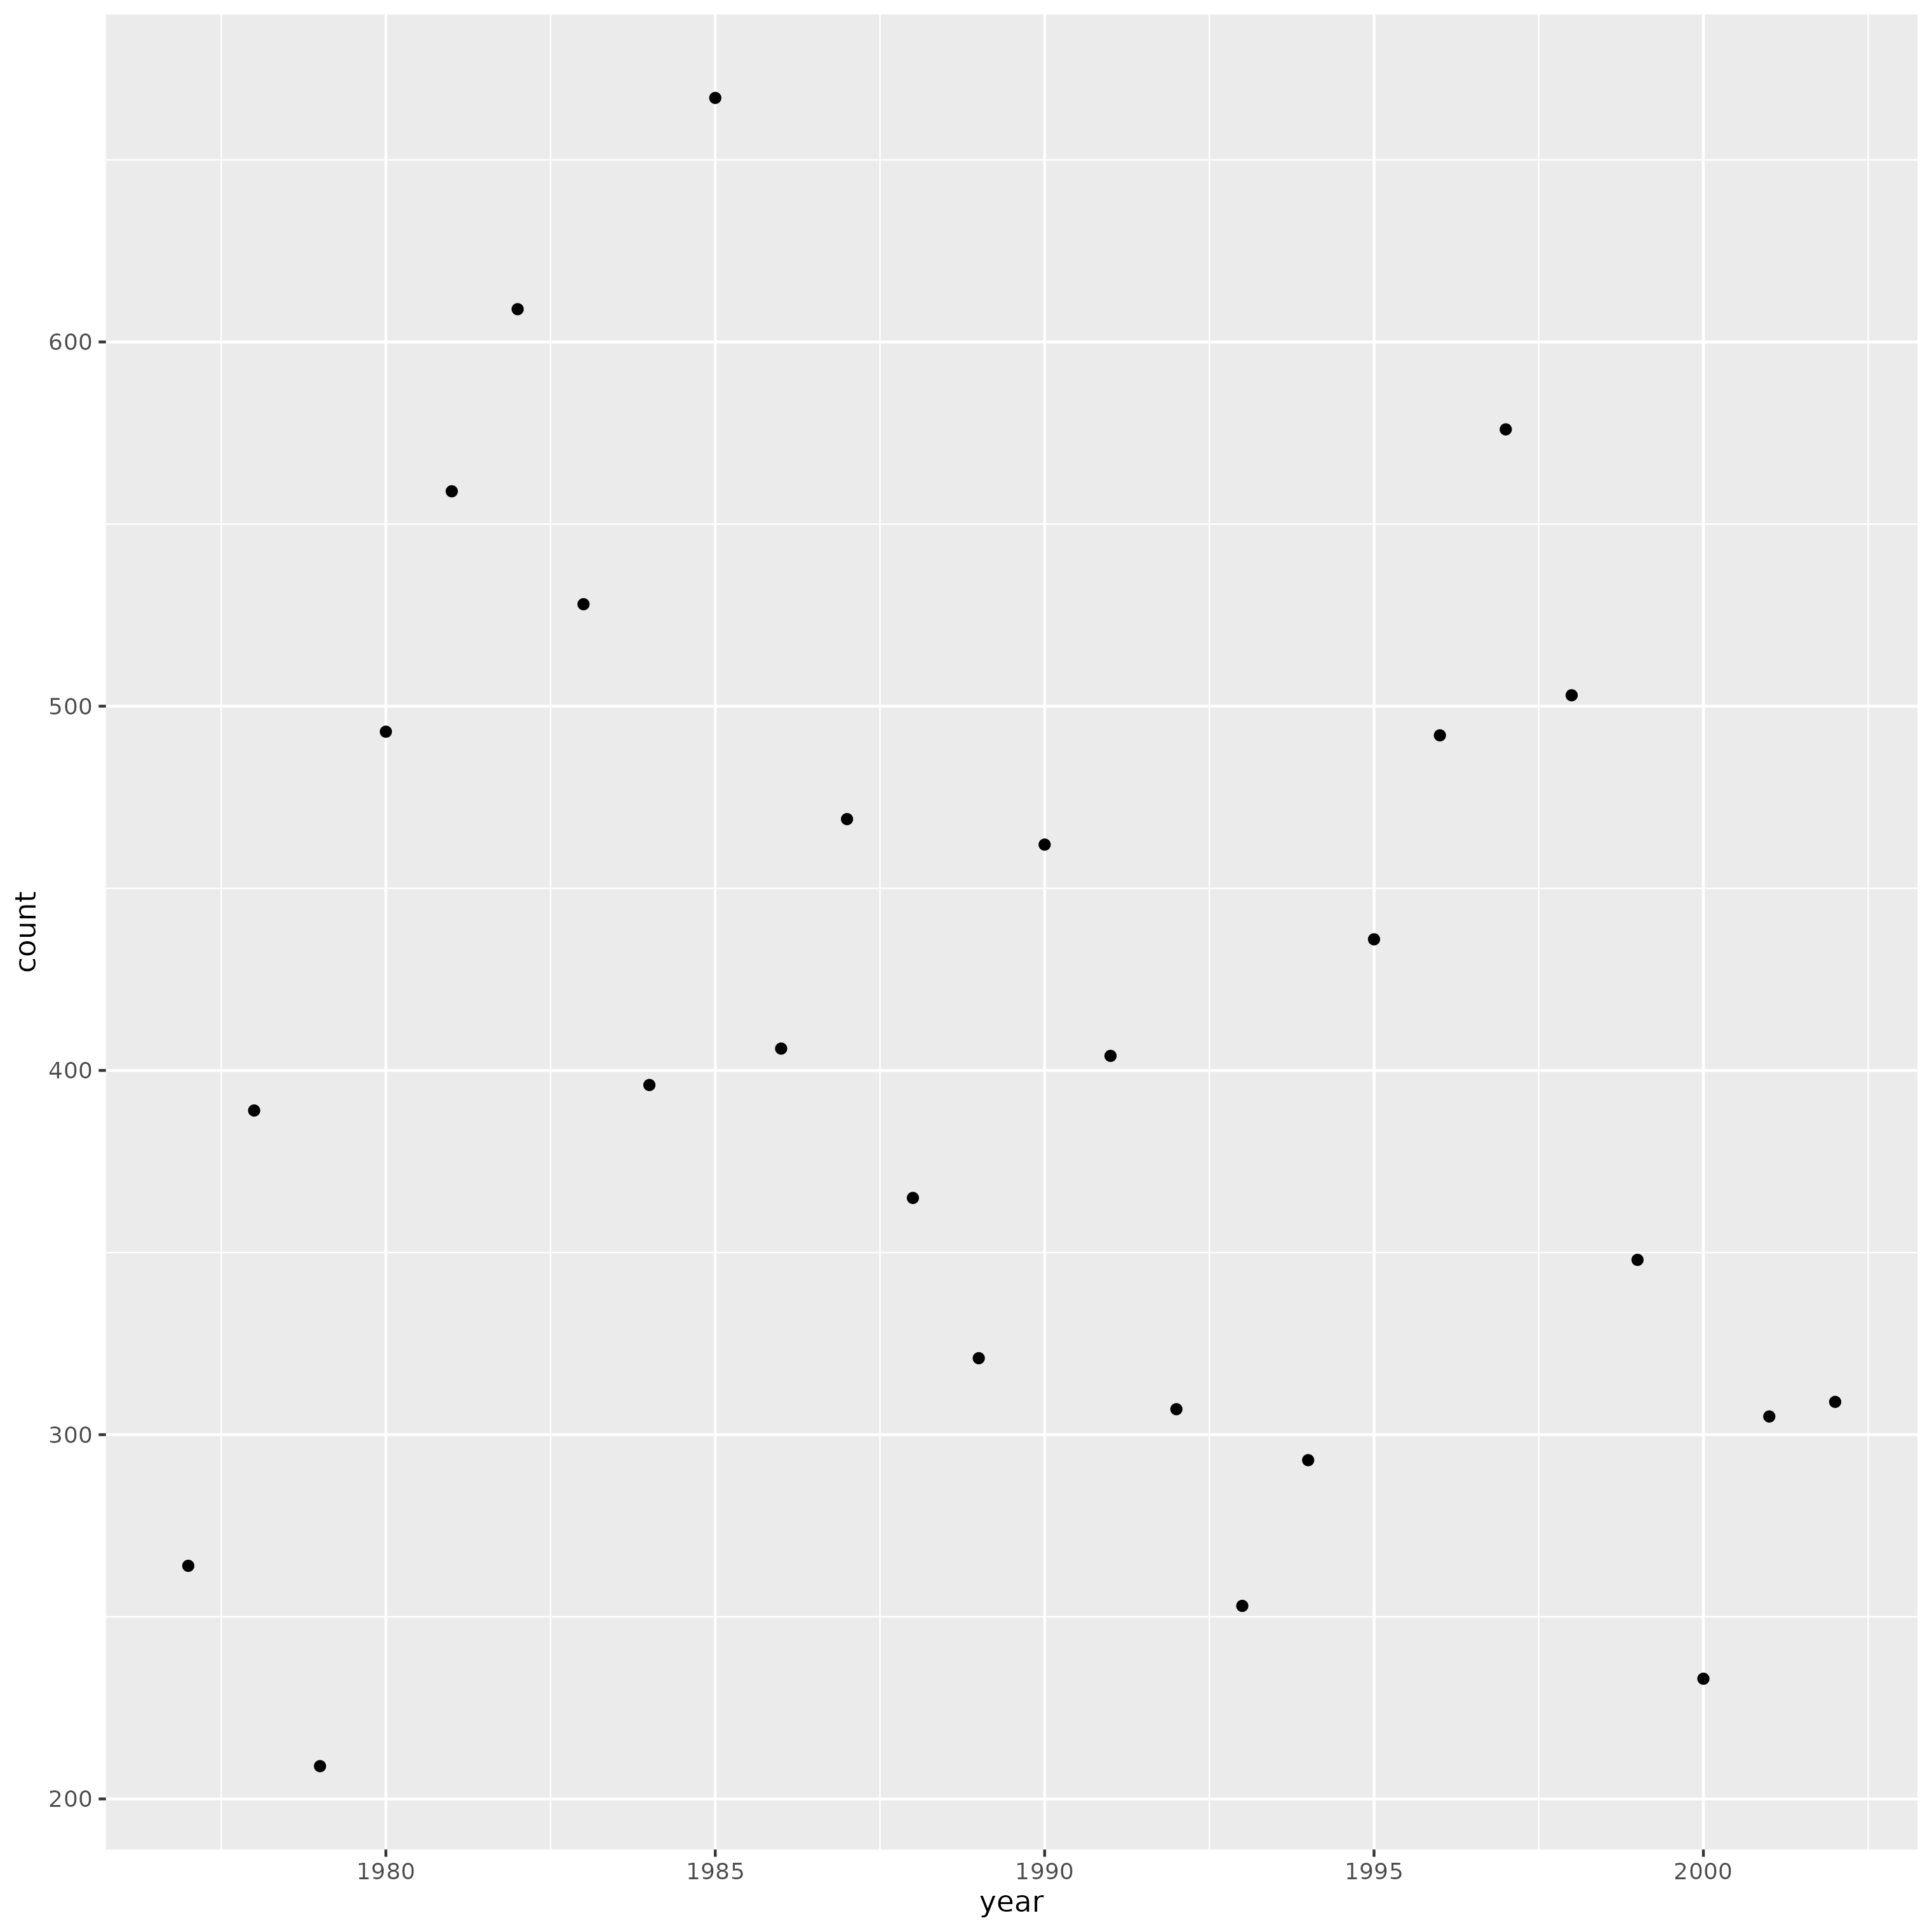
- Use your function to get the time-series for
genus="Dipodomys"andspecies="merriami"and then make a graph of this time-series usingggplotthat hasyearon the x axis,counton the y axis, and displays the data as points. - Use your function to get the time-series for
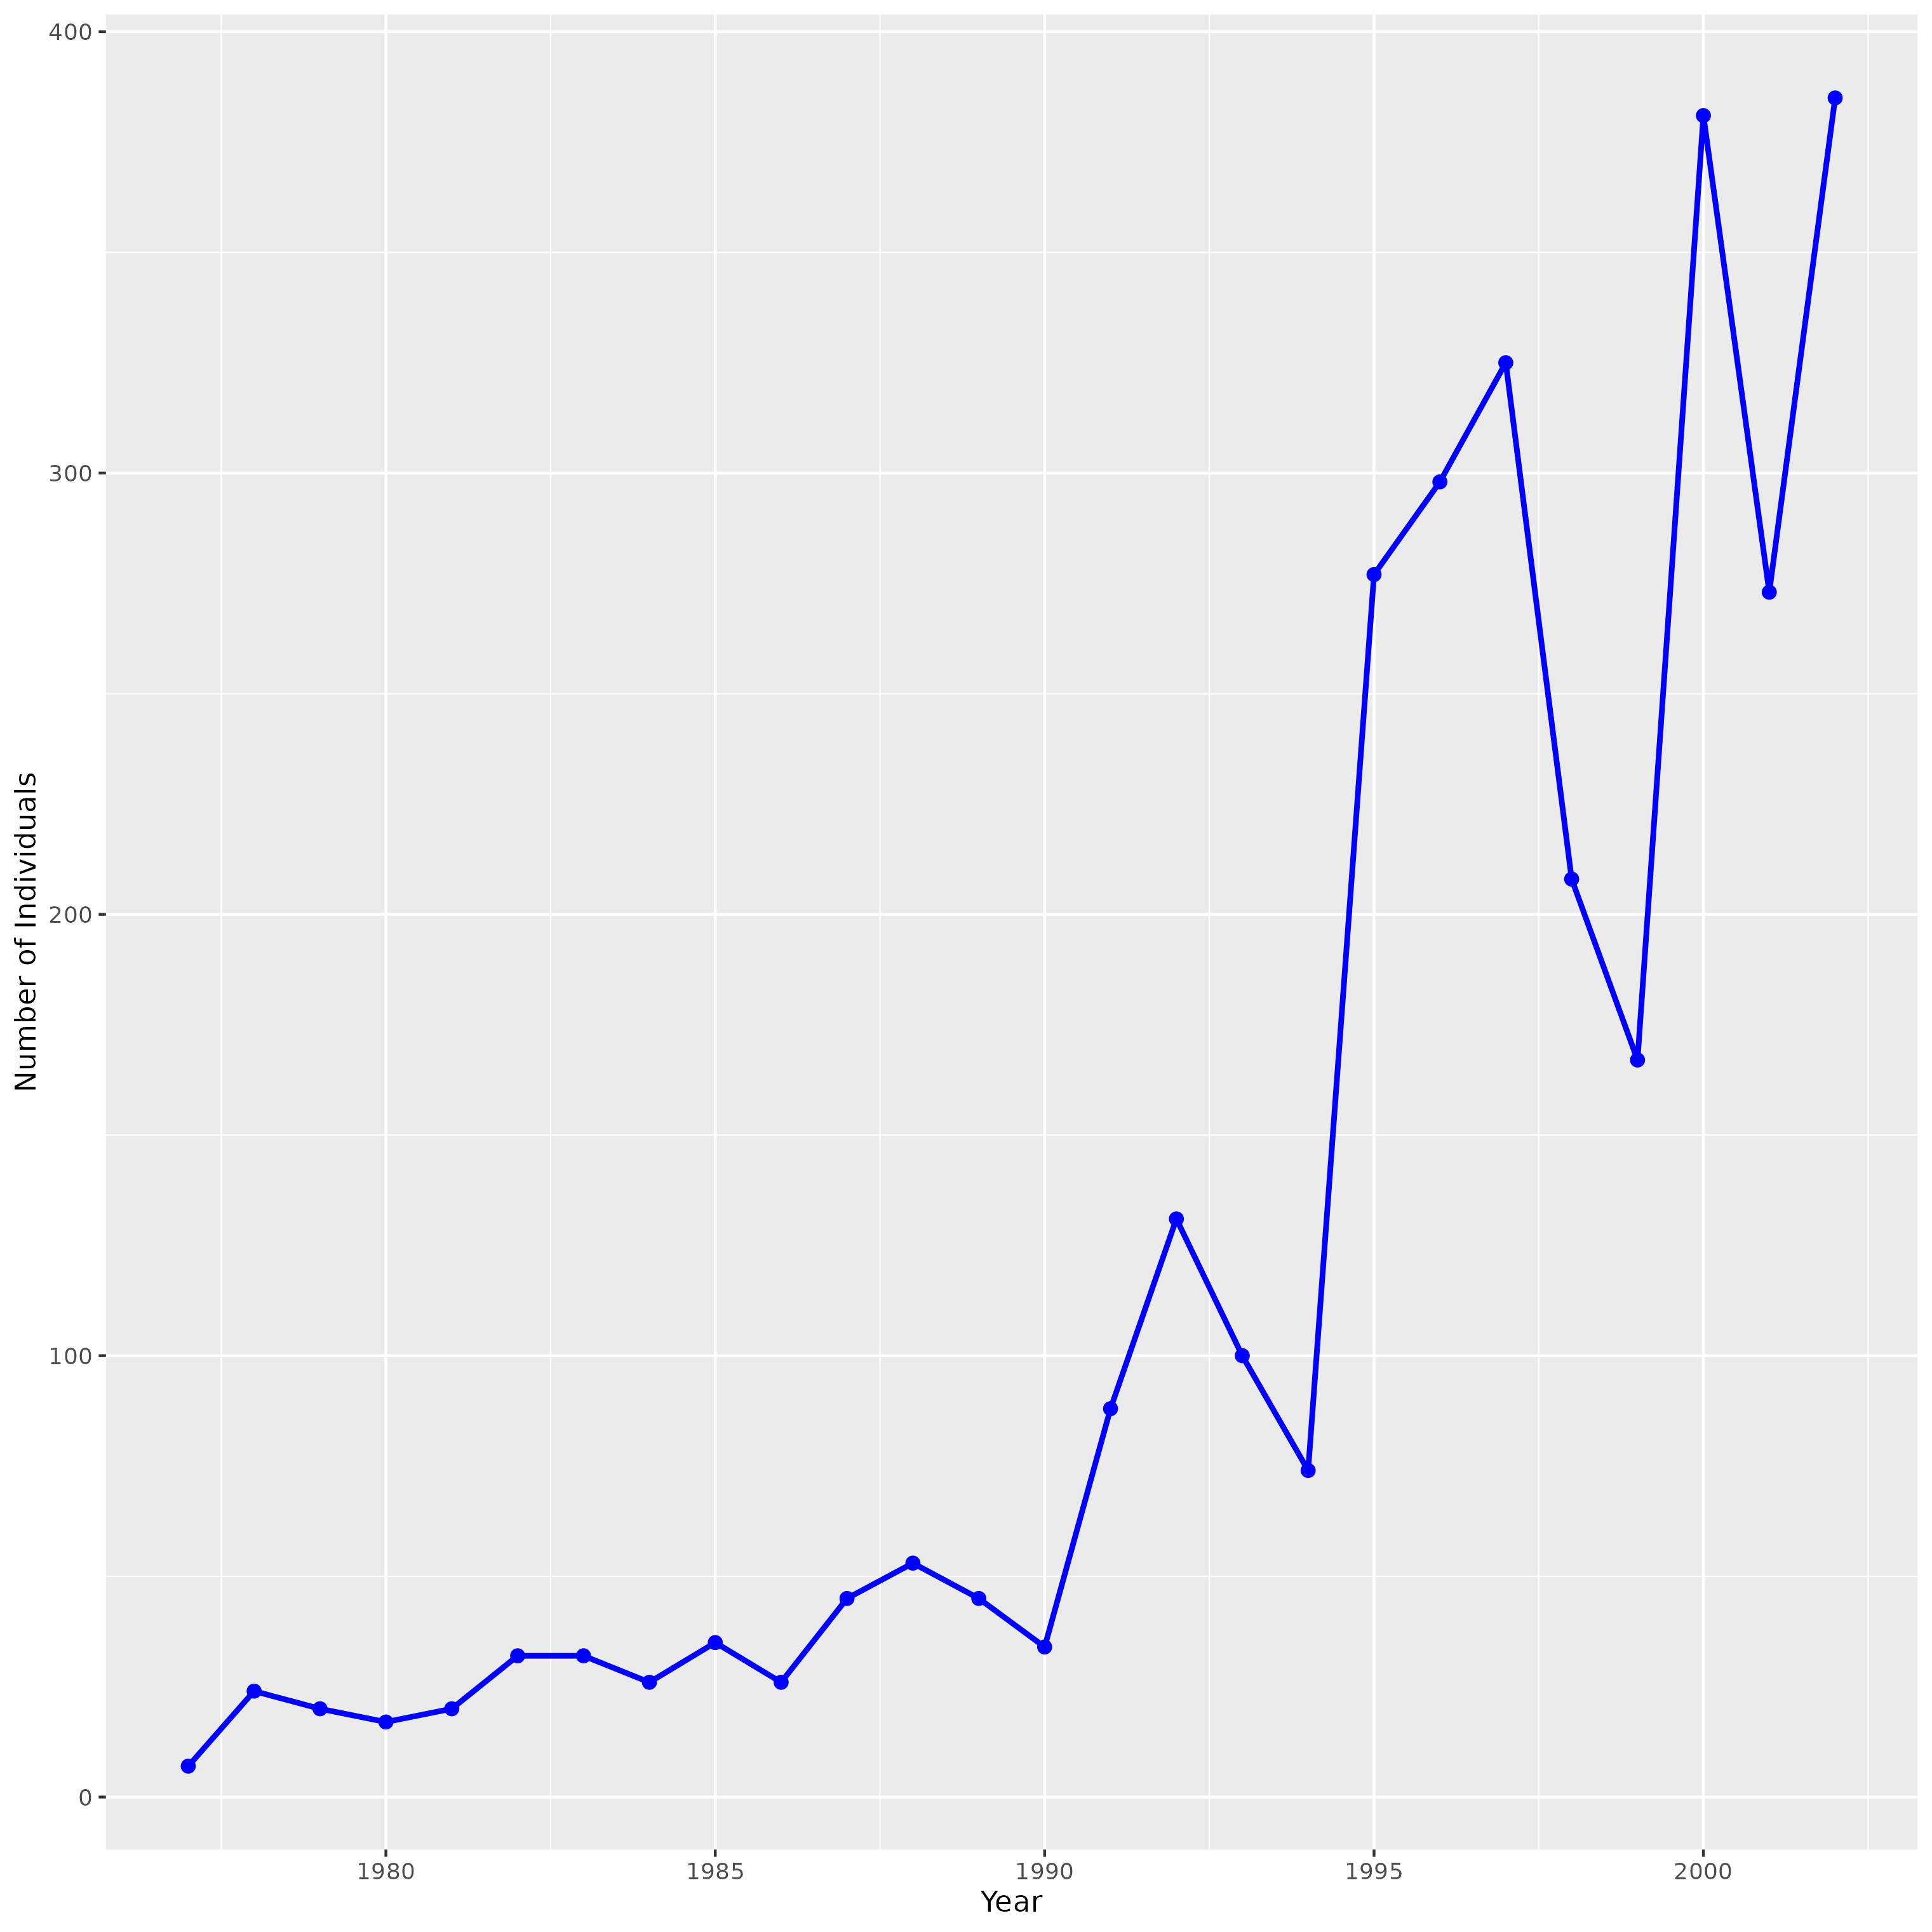
genus="Chaetodipus"andspecies="penicillatus"and then make a graph of this time-series usingggplotthat hasyearon the x axis,counton the y axis, and displays the data as blue points (with size = 1) connected by blue lines (with size = 2). Change the x axis label toYearand the y axis label toNumber of Individuals
- Combine the